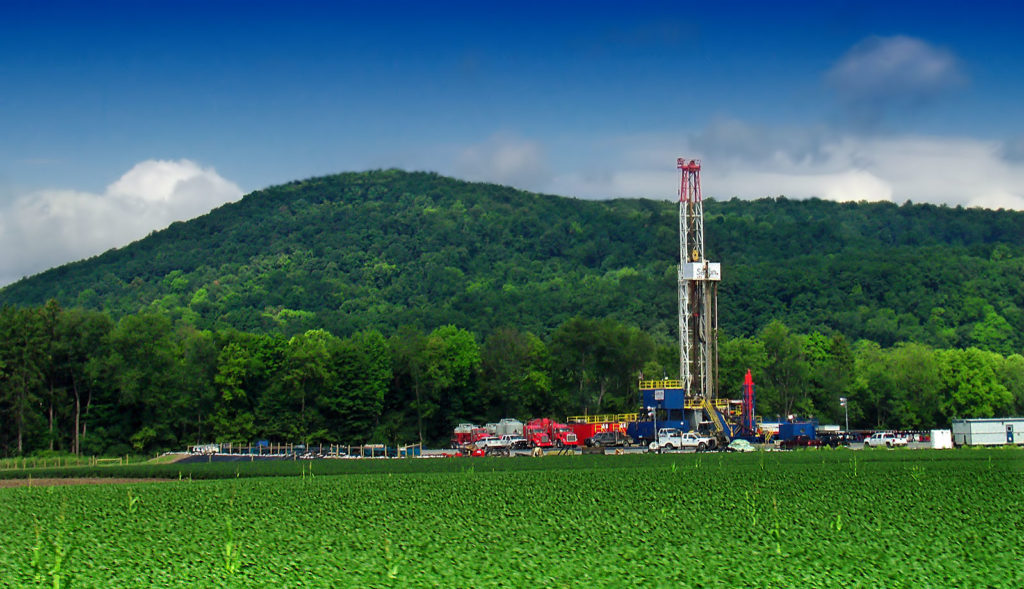
Marcellus shale gas-drilling site in Pennsylvania.
Photo: Nicholas A. Tonelli.
“Prediction is very difficult, especially if it is about the future.” Niels Bohr, the Nobel laurate in Physics, is credited with this line. It is always possible to develop a model that fits the past, but much more difficult to have the same model to correctly forecast the future.
Recent analysis by EIA (Energy Information Agency) and Lazard find that the lowest cost power generation is natural gas, wind and solar. It looks clear, going forward, what to invest in, but before doing so, there may be some lessons to be learnt from the past about making predictions.
12 years ago, 2006, Booz Allen Hamilton (BAH) and Edison Electric Institute (EEI) published a study: “The Next Wave of Generation Investment.” The study, which was representative for the time, identified three dominating economic factors for the next wave of generation investments: future price of natural gas, future regulation of green-house gases (GHG), the true cost of new baseload generation technologies: new nuclear and “clean coal”, i e IGCC (integrated gasification combined cycle) with CCS (carbon capture and sequestration).
The main choices for new baseload generation were coal, both conventional coal and “clean coal”, natural gas and new nuclear. Noticeable, in the 2006 outlook wind and solar were not on the map. At that time (2005) coal provided 50% of the generation in the nation. Nuclear and natural gas stood each for 19%. The only significant renewable energy source was hydro at 6.6%.
Using the same econometric model as Department of Energy (DOE), BAH found that natural gas fired combined cycle gas turbines (CCGT) would be competitive against conventional coal at gas prices up to $5-6 ($/MMBtu). If there would be a $10-20 ($/ton) carbon price, IGCC was predicted to be more competitive than conventional coal, but still not competitive with natural gas, unless natural gas exceeded $5-6. New nuclear was expected to be more competitive than natural gas already at $4-5 natural gas prices.
Reality turned out differently, very differently. IGCC and new nuclear did not come remotely close to the optimistic cost projections by DOE/EIA (Department of Energy/Energy Information Agency), EPRI (Electric Power Research Institute), vendors and utility executives interviewed for the BAH study. The intended flagship project for IGCC and CCS, Kemper, Mississippi, failed. In fact, after many year delays and multi-billion dollar cost overruns, the IGCC with lignite coal as feedstock was abandoned in 2017 and replaced by natural gas.
The two new nuclear projects, Vogtle, Georgia, and Summer, South Carolina, have struggled. Summer has ceased work on the project. Vogtle continues with the main owner, Southern Co, Georgia Power, taking over after the vendor, Toshiba/Westinghouse, filed for bankruptcy. The two units, Vogtle 3 and 4, are now expected to get in operation 2021/22, 5 years behind original schedule. Latest cost estimates are around $25 billion. Original cost estimate was $14.3 billion.
Regarding future regulation of GHG neither carbon tax or cap and trade happened. The Clean Power Plan (CPP), first proposed in 2014, was a mandate for carbon reductions with defined targets for each State. CPP was in effect terminated in 2017. However, most of the reduction goals would probably been achieved anyhow, not because of the mandates but primarily by natural gas replacing coal.
The biggest difference, by far, from the 2006 outlook was the impact of the shale gas development. At the time for the 2006 outlook national gas prices were high, over $10. The common assumption was that liquified natural gas (LNG) would be necessary to meet the demand for natural gas, and it would keep the prices high, in the $7 – $9 range.
The concepts of horizontal drilling and hydraulic fracturing, crucial for shale gas and oil exploration, had become commercial in 1998 at the Barnett field in Texas, but it was the rapid development of the Marcellus Shale in Pennsylvania, Ohio and West Virginia that qualified for the “shale gas revolution” title. Production started in 2008 and already in September 2012 Marcellus Shale overtook the Haynesville Shale in northwest Louisiana as the leading producer of natural gas in the United States. Since 2014 Marcellus is the nation’s largest natural gas shale play, both in terms of production and volume of reserves.
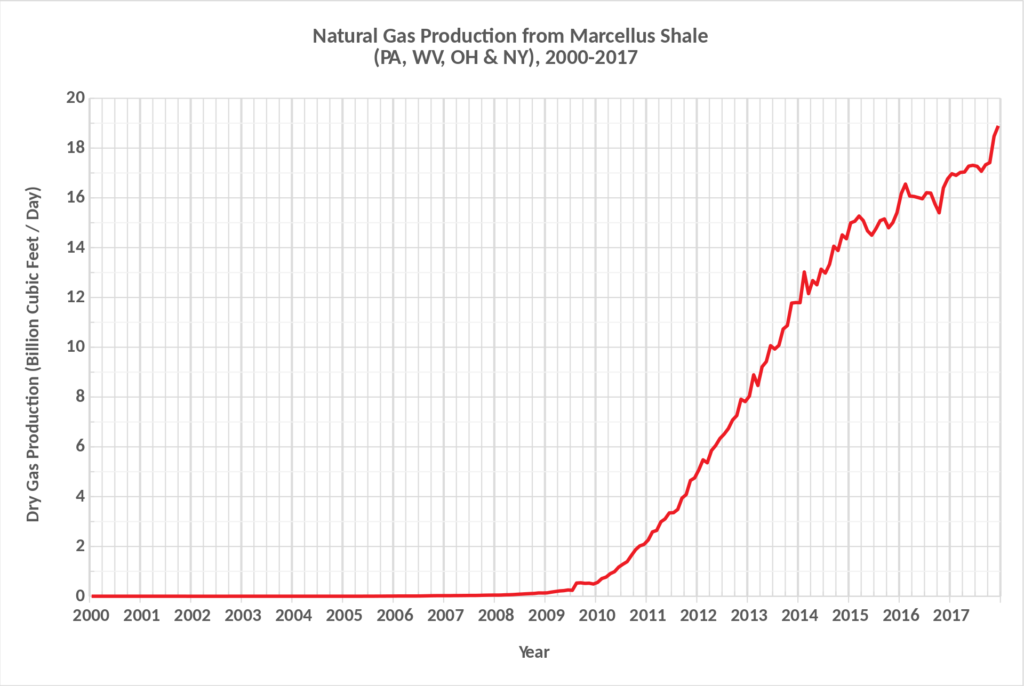
Natural Gas Production from the Marcellus Shale.
Author: Pmaccabe.
The fast growth of production contributed to natural gas prices dropping fast, to below $5 in 2010 (Henry Hub spot price) and bottomed at a $1.49 year low in 2016. Prices have then gone up some, but on the average are still low, in the $3 – $4 range.
Markets responded quickly. PJM, the largest wholesale electricity market, provides a telling example how the lower natural gas prices translated into lower electric energy prices. With inexpensive natural gas becoming available the natural gas fired power plants starting increasingly set the price. From 2009 the natural gas prices dropped 40 – 60%, the electric energy prices dropped correspondingly. Compared to the 2005–2008 time frame it was a step function drop, delivering multi-billion dollar annual savings to consumers. During 2012 to 2017 over 16,000 MW of new natural gas entered the market, while more than 20,000 MW of coal plants retired. In 2005 natural gas represented 14 % of all power generated in PJM. Twelve years later, 2017, natural gas had increased to 27 %, while during the same time coal went from 59% of to 32%. It is a remarkably fast large transition of power generation.
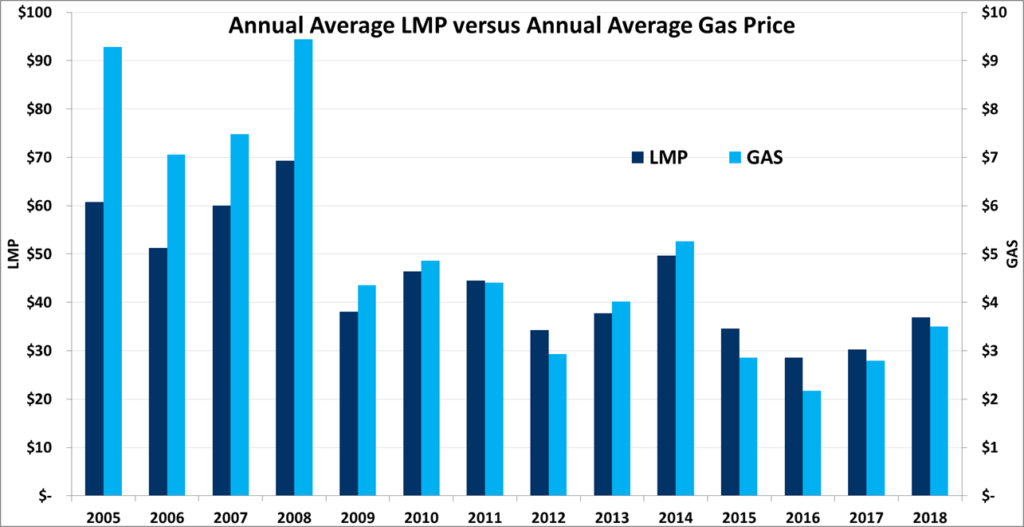
PJM locational marginal prices (LMP) show strong correlation to natural gas prices from 2009, when natural gas generation started to set price for most of the days during the year.
The net benefits of natural gas have been huge, economically and environmentally. The amount of carbon dioxide (CO2), the main greenhouse gas, emitted by the U.S. power sector has dropped by close to 30% since 2005, thanks to the transition from coal-based generation to natural gas, primarily, and wind. State-of-the art CCGT using natural gas have electric efficiency of over 60%. The average coal power plant is at about 34% electric efficiency. Consequently, when a natural gas CCGT replaces a coal power plant with the same electric output, the CO2 emissions are cut almost in half.
In addition, the low energy prices created room for much needed investments in the aging transmission infrastructure. Despite transmission investments gone from about $6 billion per year (2005) to over $20 billion per year (2015) as well as very large investments at the electric distribution level in Smart Grid and “hardening”, the average retail electricity prices rose only 14% in the last 10 years (2007-2017). These investments would most likely been politically much more difficult to do, if energy prices had been high.
In 2017 32% of all power in the U.S. was generated using natural gas. Coal produced about 30% and nuclear stood for 20%. Renewables have grown to 17%, with hydro at 7% and wind at 6%. Solar is about 2%, with 2/3 coming from utility-scale solar and 1/3 coming from distributed (“rooftop”) solar generation.
So, looking 12 years forward to 2030 what to expect? It seems likely that the main present trends favoring natural gas, wind and solar will continue. In addition, we will see more battery storage, demand response and energy efficiency. Further, distributed energy resources (DER), mostly solar, are by many expected to become more substantial.
In the 2006 outlook there were expectations of GHG being addressed by some mechanism to price carbon. It did not happen, but now it seems like a fair bet that it will happen during the coming 12 years, and probably sooner than later. Question is whether it will be nationally, or State driven? Will it be through a carbon tax or a cap and trade? Or will it be through higher targets of RPS (Renewable Portfolio Standards), ZEC (Zero Emission Credits) for nuclear, and other mandates? Or through more corporations following Amazon, Apple, Google, Microsoft and 65 other companies to commit to 100% renewables? Will there be a new set of tax credits for wind and solar? If so, will the tax credits be extended to battery storage? Etc., etc. Realistically, the most likely outcome is an “all of the above” combination.
Whatever the combination will be, developing markets and allow them to work will be the most efficient way to accelerate change. After all, it was markets that fastest captured the shale gas revolution, reducing electric energy prices and reducing CO2.
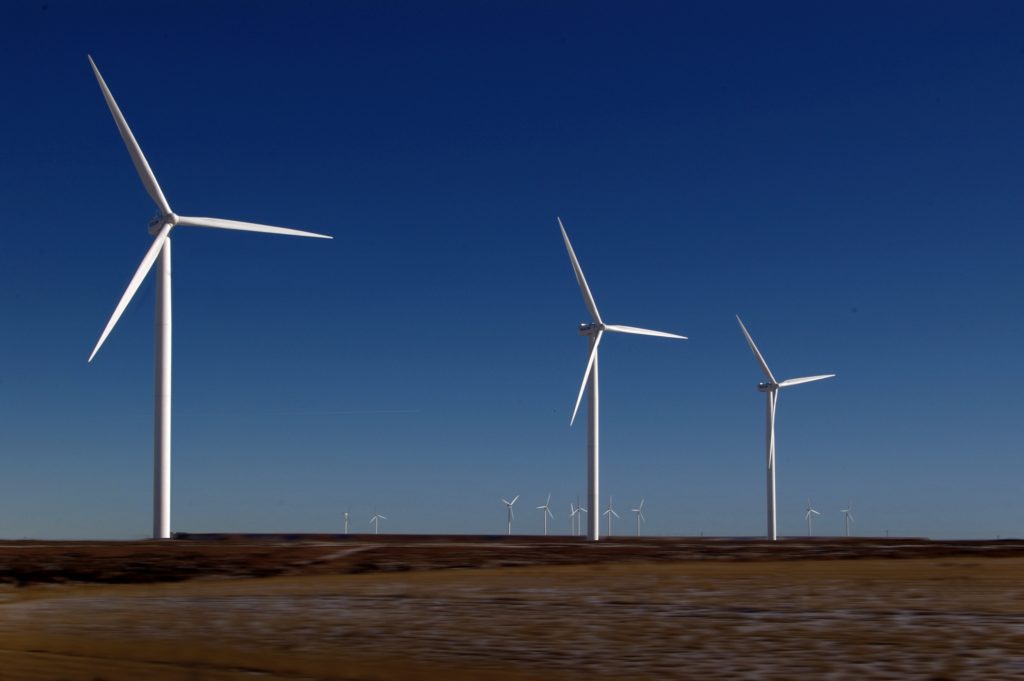
In the next 12 years, if wind and solar will grow with a similar big leap as natural gas did in the last 12 years, renewables will exceed 30% of the power generation by 2030.
Photo: Johan Bos.
Footnote: “Carbon” refers to greenhouse gases (GHG). The dominant greenhouse gas is carbon dioxide (CO2), which are 81 % of the US GHG (2016). Other greenhouse gases are methane (10 %), nitrous oxide (6%) and fluorinated gases (3%). GHG are measured in CO2 equivalent, CO2e.