Achieving “zero carbon emissions” (see footnote) without compromising safety and reliability, while keeping costs affordable, is not a trivial task. Countries that have succeeded or have come close are countries with a dominant portion of hydro power, for example Norway, Island, Costa Rica, Brazil, Canada. Also, countries like France and Sweden, with a mix of nuclear and hydro have achieved over ninety percent of zero emissions.
Hydro power is renewable, flexible, and generally low cost. Hydro dams are also energy storage resources. Hydro power like geothermal power and biomass power are dispatchable generation.
Not all countries or states are fortunate to have access to large amounts of hydro resources or geothermal. Looking for other sources of renewable energy, wind and solar have become the preferred choice, being “dark green” renewables and low cost. The downside is that they are intermittent and variable. To some degree the variability can be mitigated/managed by advanced forecasting tools. Nevertheless, when the wind is not blowing there is no power generated, and when it is dark there is no power from the photovoltaic (PV) solar installations.
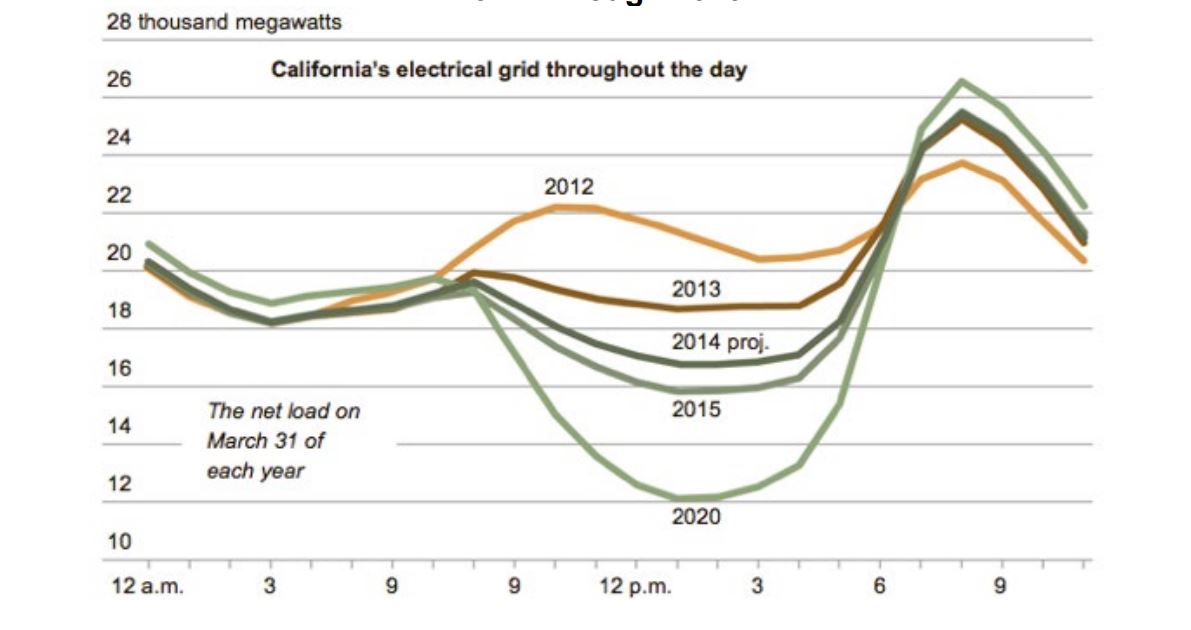
With no fuel costs, and frequently helped by mandates or feed-in-tariffs as in Germany or production tax credits as for wind here in the U.S., wind and solar are increasingly becoming part of the baseload generation. But it is not baseload generation in the traditional sense of being dispatchable and constant. To balance supply with demand, other resources are needed to fill the gap. For solar the daily gap is predictable. The “duck curve” (see graph below) shows the need for resources that can ramp up fast. Wind does not have a similar diurnal pattern as solar and changes in output may not happen as fast, but the variations can be significant indeed, and thus add to the need for dispatchable and flexible resources.
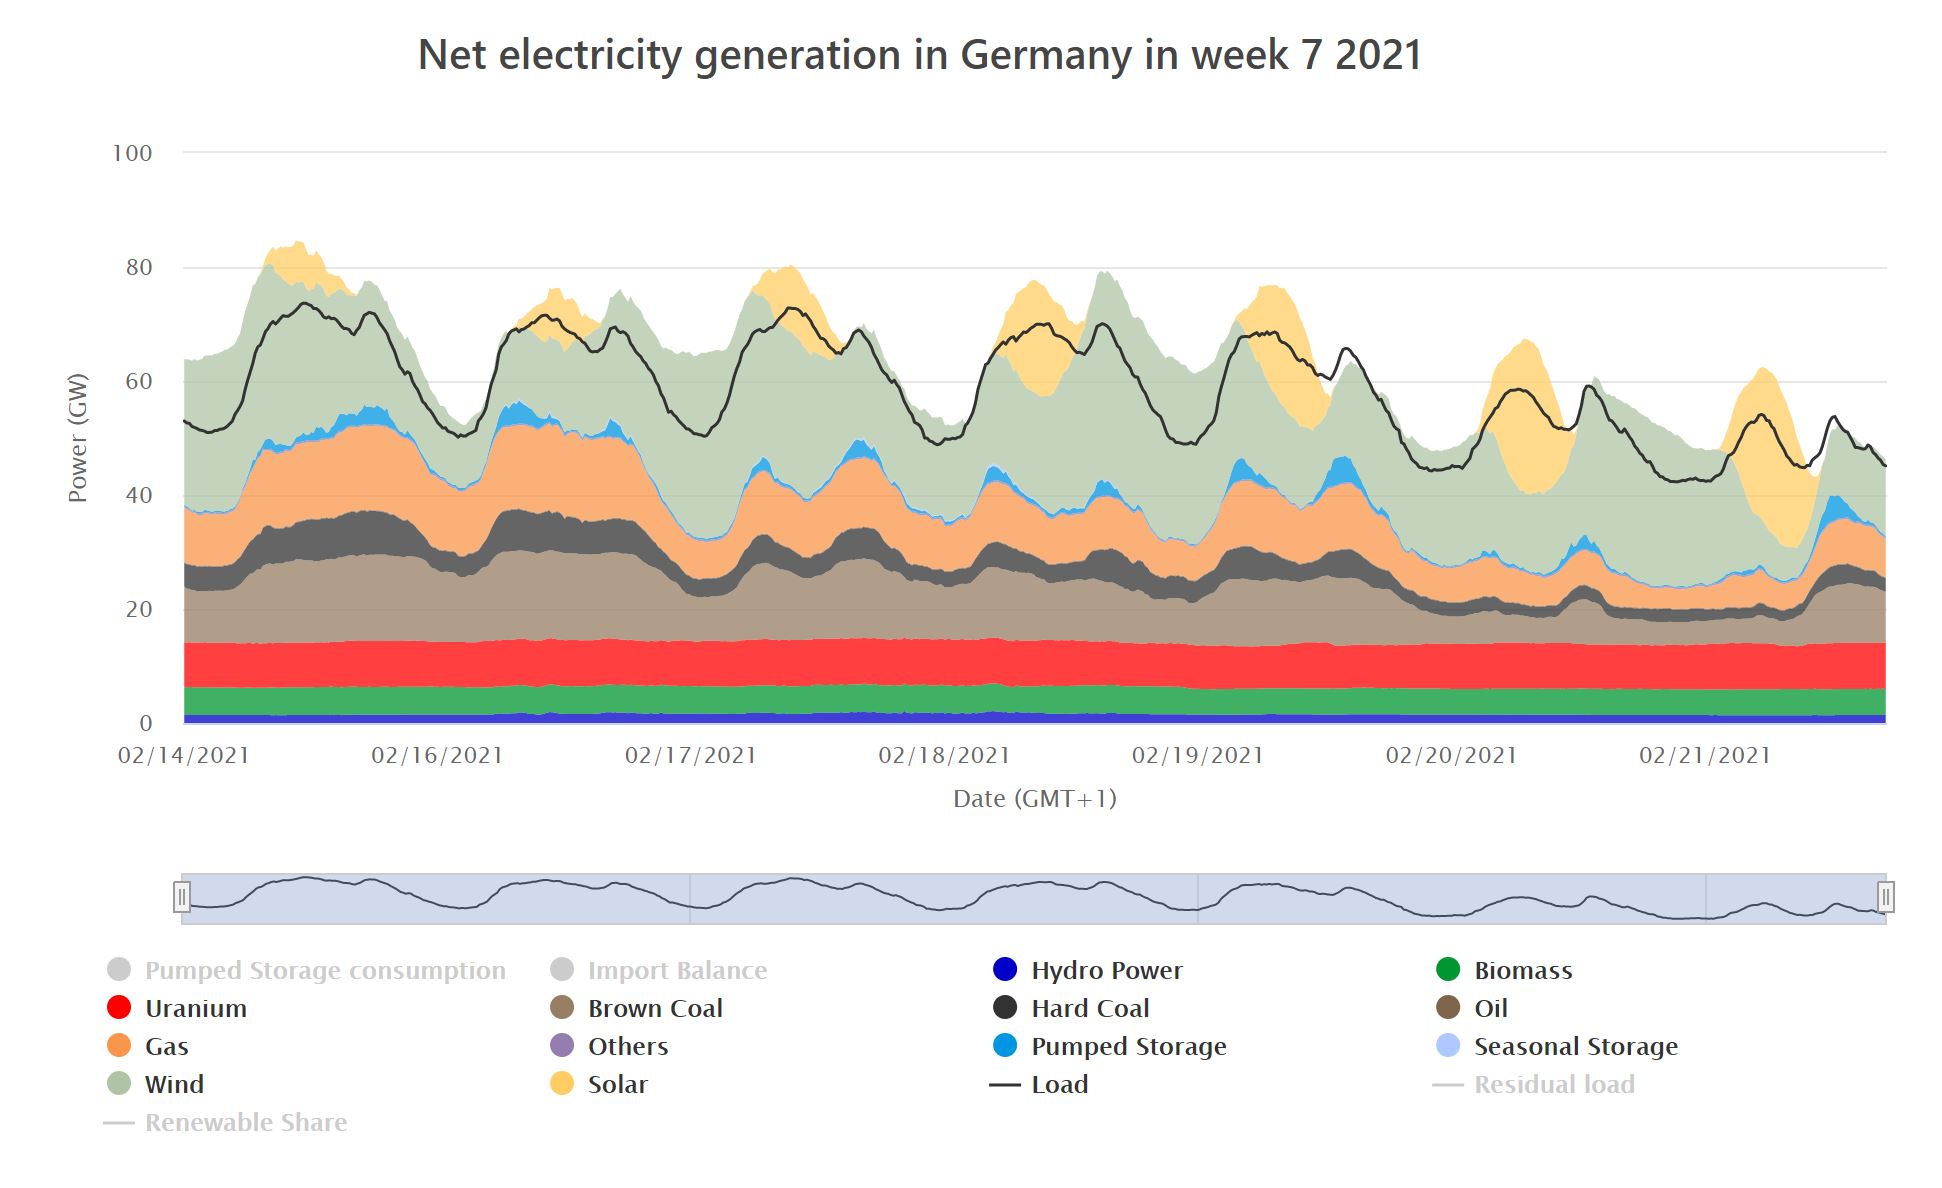
Germany with a peak demand of 83 GW and, on average (2019) 20.7% wind and 7.7% solar, illustrates the variations. The graph below shows week 7 this year, a typical week for the season. (Week 7 is the same week as the winter events in Texas). However, the hourly variations are much bigger than what can be seen from the graph. The wind at its maximum produced 36.6 GW and at its minimum 5.3 GW. Corresponding numbers for solar were 28.1 GW and 0 GW.
Operating an electric system reliably and reasonably affordable with large amounts of variable resources, wind and solar, is possible, but it requires a paradigm shift in planning and operations. Weather will have a much larger impact on both demand and supply. Balancing generation and load will need to increase both in frequency and amplitude.
One would think that a new paradigm in operations and planning should be a given but judging from all the blames and denials after the rolling blackouts in Texas in February this year, and to some degree also from the rolling blackouts in California in August last year, it seems not yet to be case. Unless changed, the risk for more rolling blackouts, will not go away. On the contrary, with more variable resources being added to the system, the risk will increase, unless major changes in thinking and actions. In the context of goals of 100% decarbonization of the electric power sector we are just in the beginning. Texas, with a peak demand at 74 GW, in 2019 had 32.2% zero emission generation, of which 20% was wind and 10.8% was nuclear power. The same year California, with a peak demand at 47 GW, had 50.5% zero emission generation, of which 25.6% was hydro and nuclear. Wind and solar was 10.2% and 12.3% respectively. Just imagine what may happen, if one would try to have 30-50% of variable resources without taking more comprehensive approaches to safeguard the reliability!
To balance the variable resources, wind and solar, one needs a combination of adequate and flexible generation, electric transmission to export excess power and import during deficits of power, as well as storage and flexible load.
Resource adequacy is about ensuring enough power generation resources to meet a defined required reserve margin to meet the expected loss of load criteria (LOLE), commonly set to 1 event in 10 years. Inputs for the models are load forecasts and data-based assumptions of forced outage rates for the different types of generators. The models are also incorporating assumptions about realistic levels of possible imports of power. However, with variable resources it gets more complicated. To address the impact of variable resources the concept of effective load carrying capability (ELCC) has been developed. ELCC is a measure of a generating resource’s ability to produce electricity when the grid is most likely to experience power shortfalls. In general, the more variable resources on the system, the lower ELCC will get. Since first used around 2009 by MISO (Midcontinent Independent System Operator) for wind resources, the ELCC concept has become adopted by most of the RTOs/ISOs in the U.S., but there are differences in how to calculate it and how rigorously it has been deployed and acted upon.
With more variable resources, wind and solar, on the system, it is becoming increasingly important that the dispatchable resources are flexible and can respond fast. Hydro power and natural gas fired generation, both combined cycle gas turbines (CCGT) as well as dedicated “peaker units”, are the most flexible resources. In most parts of the country natural gas generation is the main resource to balance the load and fill the gaps when the variable resources are short. However, at extreme weather events, as experienced in the northeast and mid-Atlantic during the Polar Vortex 2014, and the extreme cold in Texas last month, there is a limit how much natural gas generation can ramp up. The capacity of the gas infrastructure to support all demands, not only for power generation but from all users of natural gas tends to set the limit. To some degree it can be mitigated by dual fuel configurations of the gas plants.
The ability to balance surpluses and shortages of power is largely dependent on the transmission ties with neighboring systems. Germany is a great example how much it means. Looking at week 7 this year, same week as shown earlier, the export/import is roughly about 15% of the daily peak. It is part of the daily routine and an economical way to balance the system. In extreme events Germany could import up to 20% of its power needs. The latest addition of interconnections is the NordLink HVDC (High Voltage Direct Current) subsea cable between Germany and Norway with a capacity of 1400 MW. It was energized earlier this year (2021).

Denmark, which is a world leader in amount of wind on its system, 53.6% in 2019, has been able to do so without compromising the reliability thanks to extraordinarily strong electric ties with neighboring countries. In fact, the transmission interconnections have enough capacity to import all of Denmark’s power demand! Most of the interconnections are by HVDC to Sweden, Norway, and The Netherlands. In addition, a 1400 MW HVDC link to England is expected to be built and energized in two years (2023).
California early realized the importance of strong transmission ties to neighboring systems. The Pacific Intertie with both HVDC and HVAC (High Voltage Alternating Current) was at its time in the largest HVDC project in the world. After expansions, the transmission ties with the Pacific Northwest have in total almost 8000 MW of capacity. In 1990 the Intermountain HVDC was energized. With a 1600 MW capacity the transmission line connected coal fired generation in Utah with Los Angeles. (The 1900 MW coal fired power plant is scheduled to be retired in 2025 and replaced with a new 840 MW CCGT, which will be run on 70% natural gas and 30% hydrogen.) In addition, California has strong HVAC ties with Arizona and Nevada with in total 10.6 GW of capacity. Altogether these transmission ties have enabled California to early exit all oil and coal fired power plants. In 2019 California imported 25% of its electric consumption.
Despite all the transmission capacity California could not import enough power, when a heat wave hit in August last year (2020). However, it was not due to physical constraints, but because neighboring states were also hit by the same heatwave and did not have enough excess to export to meet all demands from California. Demand peak hit 47 GW at t 6.51 pm August 14. It resulted in rolling blackouts, but much smaller in magnitude and duration than what happened in Texas last month (February 2021). The demand peak was lower than the record demand peak at 50.3 GW in 2006. The generation from wind and solar was lower than average, and there was not enough of flexible generation, primarily natural gas fired power plants, to both fill the gap from the drop of generation from wind and solar, as well as meet the increase in load. With the closing of the San Onofre nuclear plants in 2013 2.2 GW of baseload generation was gone and was not replaced by new dispatchable generation within California.
Contrary to the examples above Texas is electrically isolated from the surrounding systems. The 5 HVDC back-to-back interconnections have a total capacity of 1.1 GW, which is only about 1.4% of Texas’ demand peak power. It is by political choice to keep Texas outside FERC’s jurisdiction.
Kauai, Hawaii, has no electric ties with the rest of Hawaii. It is not by choice but because it is technically/economically not possible. Kauai is served by Kauai Island Electric Cooperative (KIUC), which was formed in 2002 when it acquired Kauai Electric from Citizens Utilities. Their strategic goal is to achieve at least 70% renewable resources by 2030 and 100% by 2045, while maintaining system reliability at 99.96% or better availability. KIUC is well under way to achieve the goals. The system is small, peak power is only 79.6 MW, but in terms of taking a comprehensive and systematic approach in handling large amounts of variable resources, KIUC can serve as a benchmark.
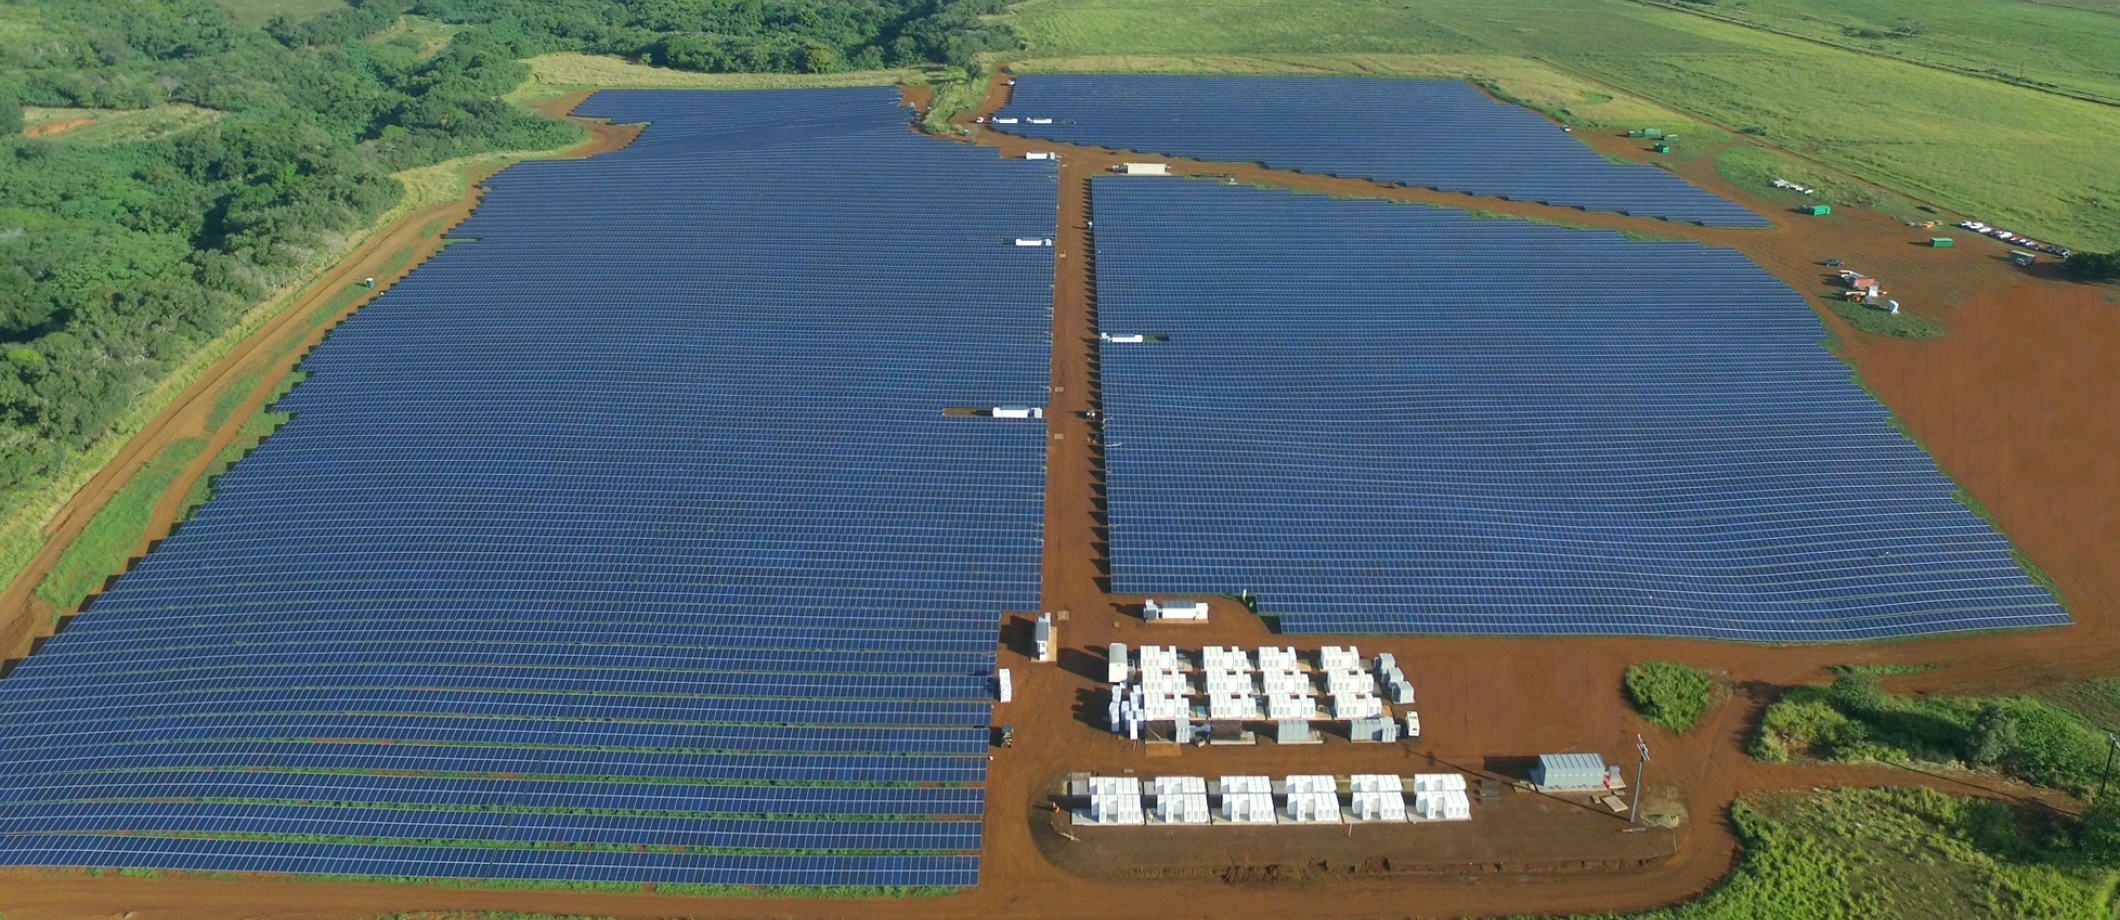
In 2011 renewables was only 8% of the power generated. By 2019 it has grown to 56%. 32.5% of all power is from solar, making Kauai a leader in solar. 10.5% is from hydro and 9.9% is from biomass. As of 2018 Kauai had a 99.979% (1.83 average hours per customer and year) reliability factor. With the high amounts of solar KIUC early recognized the value of battery storage for ancillary services and diurnal storage. Two large lithium battery systems have been installed, 13 MW/52 MWh by Tesla and 20 MW/100 MWh by AES. In theory the two battery systems could support all the load on Kauai for up to 8 hours. KIUC is now working on a 25 MW solar powered pumped hydro storage project, targeting completion in 2024. When achieved, renewables will provide about 80% of the power on Kauai.
For a system of Texas size, assuming 45 GW on average, just to have 4 hours of battery storage, one would need 180 GWh of battery capacity. To achieve that amount, one would need 7.5 years of full production at Tesla’s giga battery factory. It seems not likely to happen anywhere close to those amounts, but more battery storage can be expected to be built, taking advantage of low and sometimes negative prices during the nights. The largest battery storage system in Texas so far is a 10MW/42MWh project, which was energized in August last year (2020). GlidePath, a 100MW/400MWh battery storage project is being developed by Able Grid Energy Solutions, MAP Energy and Astral Electricity. It is expected to be completed later this year. Texas has no pumped hydro storage, but preliminary studies indicate that closed loop pumped storage in western Texas could be a possibility. A third energy storage option may be hydrogen produced from excess wind and solar generation. Such stored green hydrogen can be converted back to electric power by gas turbines or fuel cells. This can be done at the location of wind and solar farms, but the hydrogen can also be transported and used as feedstock in industrial processes. All is technically possible, but economically challenging.
California has seven pumped hydro storage facilities with a total capacity of almost 4GW. As of 2015 it represented 98% of all storage capacity in California, but with more variable resources on the system and the planned retirement in 2025 of Diablo Canyon nuclear power plant with 2.2 GW of capacity, more storage will be needed. Since trying to build more pumped storage has been an uphill battle, battery storage has become the viable option. In 2013 California Public Utility Commission (CPUC) issued a mandate for 1.3 GW of energy storage before end the decade. It was followed in 2017 by an additional mandate requiring California’s three investor-owned utilities to procure 500 MW of behind-the-meter-storage. Some of the largest battery systems in the world have been built in California, for example the 250 MW/250 MWh Gateway Energy Storage commissioned last year (2020) at Otay Mesa, near San Diego, by LS Power.
To balance the fluctuations in demand and supply, it will also be important to make load more flexible. Shaving demand peaks and/or shifting load can go a long way, as was the case in California last year during the heat wave in August, when Demand Response (DR) contributed to help avoiding more days of rolling blackouts. FERC Order 745 in 2011, basically DR to be compensated as generation to serve load, gave DR a big boost. PJM has cleared about 9 GW of demand response in its capacity market. The order was challenged but in 2016 the Supreme Court upheld the order. In 2020 FERC with Order 2222 took a step further to also enable Distributed Energy Resources (DER) to participate in wholesale electricity markets.
Variable resources, wind and solar, are part of the fuel mix in decarbonization of the power sector. It can be accommodated without compromising reliability, starting with recognizing the intermittency and variability. Identifying how to fill the gaps when wind and solar is short. Investments in wind and solar require investments also in a combination of dispatchable and flexible generation resources, transmission, storage, and flexible load. These resources need to be there when the wind or the solar is not generating enough electricity. If not, it does not matter how high the energy prices can get. The price signals will be too late, something Texas experienced the hard way three days in February.
Footnotes: The expression “zero emissions” is here used to describe power generation technologies with no greenhouse gas emissions during generation. It does not include emissions of the complete supply chain from mining all the through decommissioning/scrapping/recycling.

More Read: