The U.S. electric industry is undergoing an unprecedented transformation, in terms of magnitude and speed, from a dominance of coal to more natural gas, wind and solar.
Natural gas fired combined cycle generation has among the lowest levelized cost of electricity (LCOE). Between 2006 and 2014 natural gas prices fell by 34 %. Meanwhile the average retail electricity price rose by 17%, which is about the same rate as consumer price index during this period. Only one state, Texas, saw a significant decrease, 13 %, in retail electricity prices.
It triggers the question: Do lower energy costs also mean lower electricity prices for the consumers? The question is straightforward. The answer is more complicated. It is “Yes and No”. Let’s elaborate by looking at available data for the last 10 years.
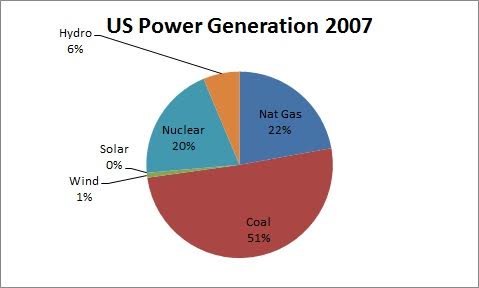
As late as 2007 coal was the dominant fuel for power generation. Natural gas fired power generation had been growing, but it was with development of the Marcellus shale gas, starting in 2008, it really took off. In just four years Marcellus became the biggest gas producing field in the U.S., resulting in a big drop in natural gas prices. The EPA (Environmental Protection Agency) MATS (Mercury and Air Toxic Standards) rules accelerated the transition from coal. The final rules came out in December 2011 allowing four years to comply. Many, mostly old, coal plants without sufficient emission controls decided to retire.
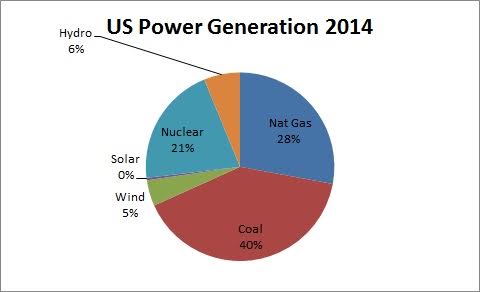
Wind had been growing slowly but steadily. In 2005 there was about 10 GW of wind power installed. Thanks to lower costs by scaling wind turbines and helped by a 2.3 cents/kWh federal production tax credit wind generation started to grow exponentially around 2005/6. By 2011 there was 47.5 GW of wind generation capacity and by 2014 wind represented 5 % of all power produced in the U.S.
Solar photovoltaic (PV) is the most recent addition to the fuel mix. PV was insignificant until 2010 when it started to grow exponentially thanks to economies of scale in manufacturing as well as a federal investment tax credit. Several states also supported PV to get going by net metering programs. By 2011 there was almost 2 GW of PV installed and by 2015 there was over 7 GW of PV. With the continuation of the federal investment tax credits PV, both utility scale and distributed (“rooftop”) are expected to grow at a fast pace.
Both wind and solar as well as other renewable energy sources benefit from Renewable Portfolio Standards (RPS). About 30 states (2015) have RPS, which in terms of targets, eligible technologies, in-state requirements etc. differ from state to state. Associated with most RPS are RECs (Renewable Energy Certificates) and SRECs (Solar Renewable Energy Certificates), which provide a mechanism to financially reward eligible power producers.
The fuel mix of US power generation is now more diverse than it has been in a very long time!
Looking state by state there are surprisingly big differences in fuel mix and retail electricity prices. In order to explain the price/rate differences one has to analyze each state in more detail. Is the state part of a wholesale electricity market? Is that state’s retail market regulated or deregulated? Is the state a net exporter or importer of electric power? What is the mix of generation? Does the state has a RPS and if so, how is it structured? Are there state initiatives for energy efficiency? Are there legacy costs or subsidies to specific types of generation? Etc., etc.
Generally 40 – 60 % of the retail price customers pay is the wholesale electricity price, which includes the cost of generation and transmission. Added to the wholesale cost are costs for the distribution grid, other costs and markup for the load serving entity as well as costs to pay for various state initiatives.
Wholesale electricity markets are transparent and immediately reflect changes in the electric energy prices. For example PJM, the largest wholesale market serving 13 states and District of Columbia, has shown in the last 10 years a trend of lower energy prices, primarily driven by natural gas setting the price. By definition of a market there have been and can be big swings with price spikes in times of high demand, low supply and/or constraints in the transmission grid or in the gas infrastructure.
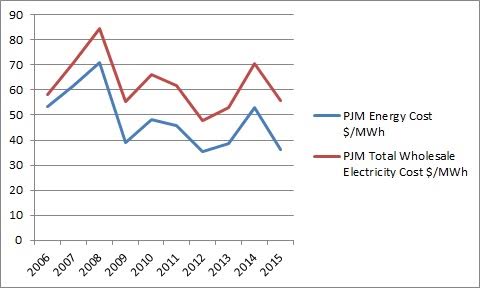
The figure above shows how the energy cost and the total wholesale electricity costs developed from 2006 to 2015 in PJM. During this period the total wholesale cost dropped by 4 %, while the energy cost dropped by 32 %. The big drop in energy costs was offset by increased costs for capacity and transmission. Thus in 2015 PJM’s total wholesale electricity cost was 5.6 cents per kWh, including the energy cost at 3.6 cents per kWh, capacity cost at 1.1 cents per kWh and the transmission cost at 0.7 cents per kWh. Most of the remaining 0.2 cents per kWh was made up by costs for frequency regulation, spinning reserve, black start and other ancillary services.
Pennsylvania, which is the biggest state within PJM, is a good example of a major shift from coal to natural gas.
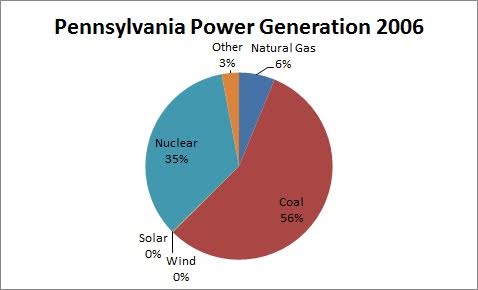
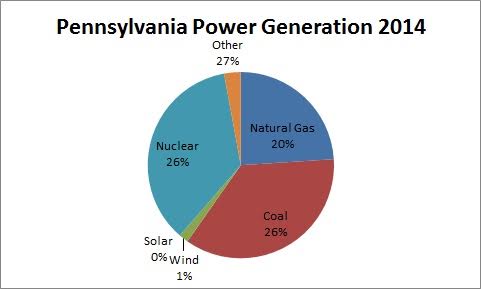
In 2006 56 % of the power generation was from coal. Natural gas fired generation was only 6 %. 2014, 8 years later, natural gas represented 20 % of the generation, while coal was 26 %. Nuclear remained by and large constant around, around 30 %. The change in fuel mix and the fact that Pennsylvania also has a retail market explains why Pennsylvania could make such a major change and still keep retail price increases at 19 % during this period, which is about the national average.
Like Pennsylvania Texas have wholesale and retail markets. Texas was early with natural gas fired generation.

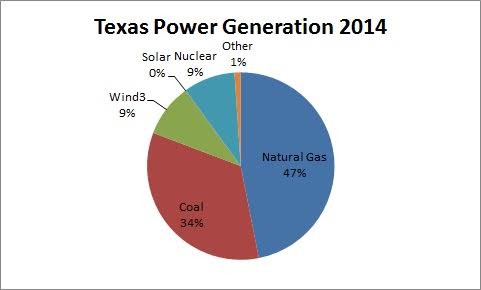
Already in 2006 natural gas represented half of the power generation. The biggest change between 2006 and 2014 is that Texas became the nation’s leader in wind generation. By 2014 wind had reached 9 % of the power generation. High portion of natural gas, significant amounts of wind and very competitive wholesale and retail markets are probably the main reasons why Texas could see a 13 % drop in retail electricity prices.
Contrary to Texas, Nebraska between 2006 and 2014 saw a 45 % increase in retail electricity prices, although the prices are still below the national average.
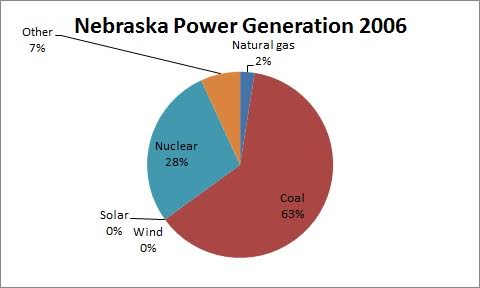
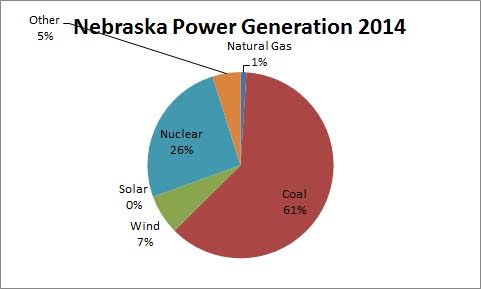
Nebraska has been late in transitioning from coal to natural gas. Only 2 % of the power generation in 2006 was natural gas. By 2014 it is still only 2 %. Coal remains 2014 the dominant fuel at 61 % of all generation. The only new addition of significance is wind power, which by 2014 was 7 % of all generation.
California has for quite some time more aggressively than any other state promoted cleaner energy and more renewable energy.
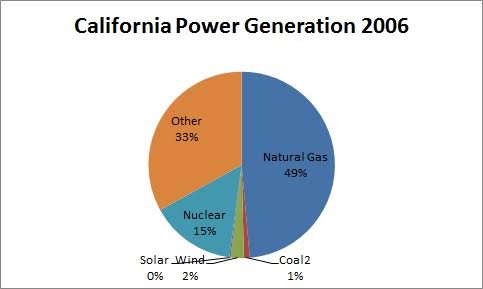
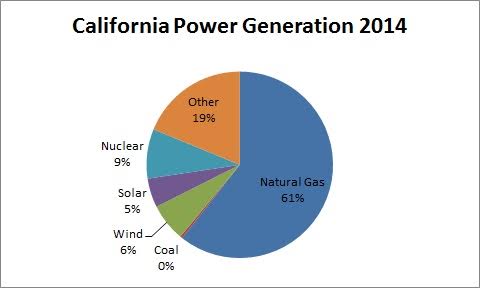
Already 2006 coal was almost all eliminated from California’s power generation. Almost half of the power generation in California was from natural gas. By 2014 natural gas fired generation had reached 61 %, wind 6 % and solar 5 %. With the closing of the San Onofre nuclear plant California nuclear was down to 9 % of the generation. The retail electricity prices in California increased by 19 % from 2006 to 2014, which is about the national average increase. At 15.2 cents per kWh California has still some of the highest retail electricity prices in the U.S. However, with the high portion of natural gas, growing amounts of solar as well as substantial amounts of low cost hydro and geothermal, the stage may now be set to achieve lower energy costs and lower retail electricity prices.
Looking forward next 4-5 years the present trends of more natural gas fired generation as well as more wind and solar will most likely continue. RPS will remain in place and will rather be expanded to more states and higher targets than to be reduced. The federal tax credits for wind and solar will last through 2020. In fact in 2015 wind stood for the largest addition of new (nameplate) capacity, 8.1 GW, followed by natural gas 6.0 GW and solar with 5.1 GW. Even after adjusted for the different capacity factors (37 %, 87 % and 25 % respectively) the numbers are significant.
In its recent (2015) 5 year outlook EIA (Energy Information Agency) estimates LCOE stay low for natural gas combined cycle generation and come down for wind and solar. Recent PPAs (power purchase agreements) for wind power and utility scale solar PV indicate even lower numbers. Thus it looks like energy prices will drop further in the next 4-5 years.
However, some of the reduced energy costs may be offset by higher costs for electric grid modernization, both at the transmission as well as the distribution system levels, and for capacity. With more variable resources, wind and solar, on the system more capacity, generation and storage, will be needed. With or without capacity markets there will be a cost for this capacity.
Even if the electricity prices/rates (cents per kWh) do not come down substantially or not at all, the electric bill for individual consumers may come down due to lower consumption. In fact the electric consumption per capita has been trending down for the last 15 years. Just between 2006 and 2014 it dropped by 8 %. Improved energy efficiency thanks to better insulated houses and buildings, more energy efficient appliances, LED lights, more efficient industry processes with variable speed drives, etc., and more distributed generation, in particular rooftop solar, have resulted in almost no load growth on the utility side of the meter. Also these trends are likely to continue.
So far the transformation of the U.S. electric industry to a cleaner and more sustainable electric system has been accomplished without disruptions and, by and large, at a reasonable cost for the consumers. It is a big accomplishment and encouraging for the ability to manage the next 5 years of continued transformation.