The AI driven data center boom, the electrification of transportation and the “reindustralization” will drive demand for electric power. Department of Energy’s (DOE) Energy Information Agency (EIA) in its Annual Energy Outlook 2026 forecasts annual growth of 0.9 – 1.6 percent through 2050. Others have higher numbers. For example, McKinsey, in an article, “Powering a new era of US energy demand” (April 29, 2025) presented a more radical outlook, also including power to produce “green hydrogen”. McKinsey expects US power demand to grow up to 3.5 percent annually through 2040. Many claim that it is an unprecedented load growth and raises sincere concerns about whether it can be met fast enough.
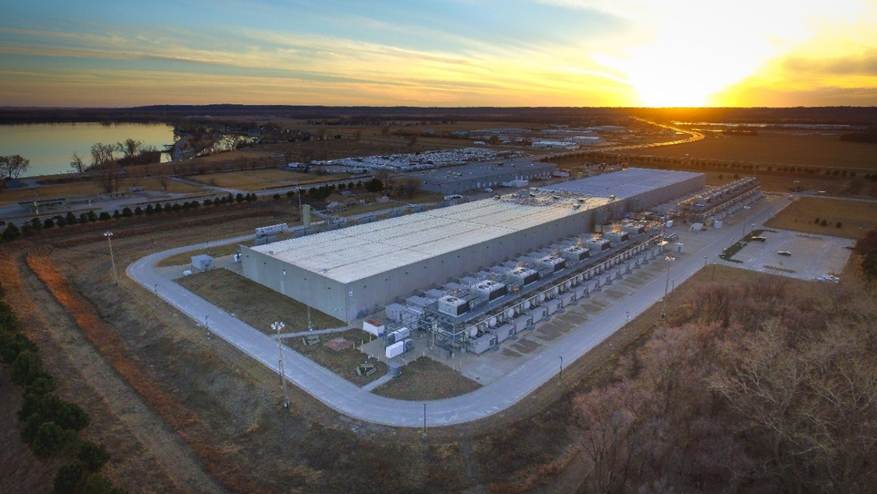
Creative Commons Attribution 2.0 Generic. Author: Chad Davis
Data centers represent large, concentrated loads of power. They compare well with heavy industrial operations, e g
| Steel mill with electric arc furnace. | 50 – 200+ MW |
| Large integrated pulp and paper plant. | 100 – 250 MW |
| Hyperscale data center campus. | 100 – 500+ MW |
| New AI focused mega camp. | 500 – 1,000+ MW |
The projected load growth has been a significant shift from the last two decades, when demand by and large has been flat. However, as Dr. Hannah Ritchie, Our World in Data, points out it is incorrect to describe the relative growth as unprecedented. In a well-researched article, “How unprecedented is power demand growth in the United States” (Substack Oct 19, 2025) she shows that during the 1950s and 1960s the annual growth in electric generation was over 5 percent, some years up to 10%. In the 1970s and 1980s it slowed down to an annual average of about 3.5 percent. During the 90s it slowed further, to about 2 percent annually. Recognizing percentage change is easier to achieve from a low absolute number, Dr. Ritchie also analyzes the growth in absolute numbers. She shows that year-to-year changes in electricity generation since the 1970s have fluctuated a lot but increases of 100 TWh have been common without causing shortages. However, assuming the 3.5% load growth going forward the annual growth in generation will go from 100 TWh year-to-year to 200 TWh by 2040. Hannah Ritchie concludes: “From this absolute perspective, the US and other countries like it will enter a unique period of electricity growth.”
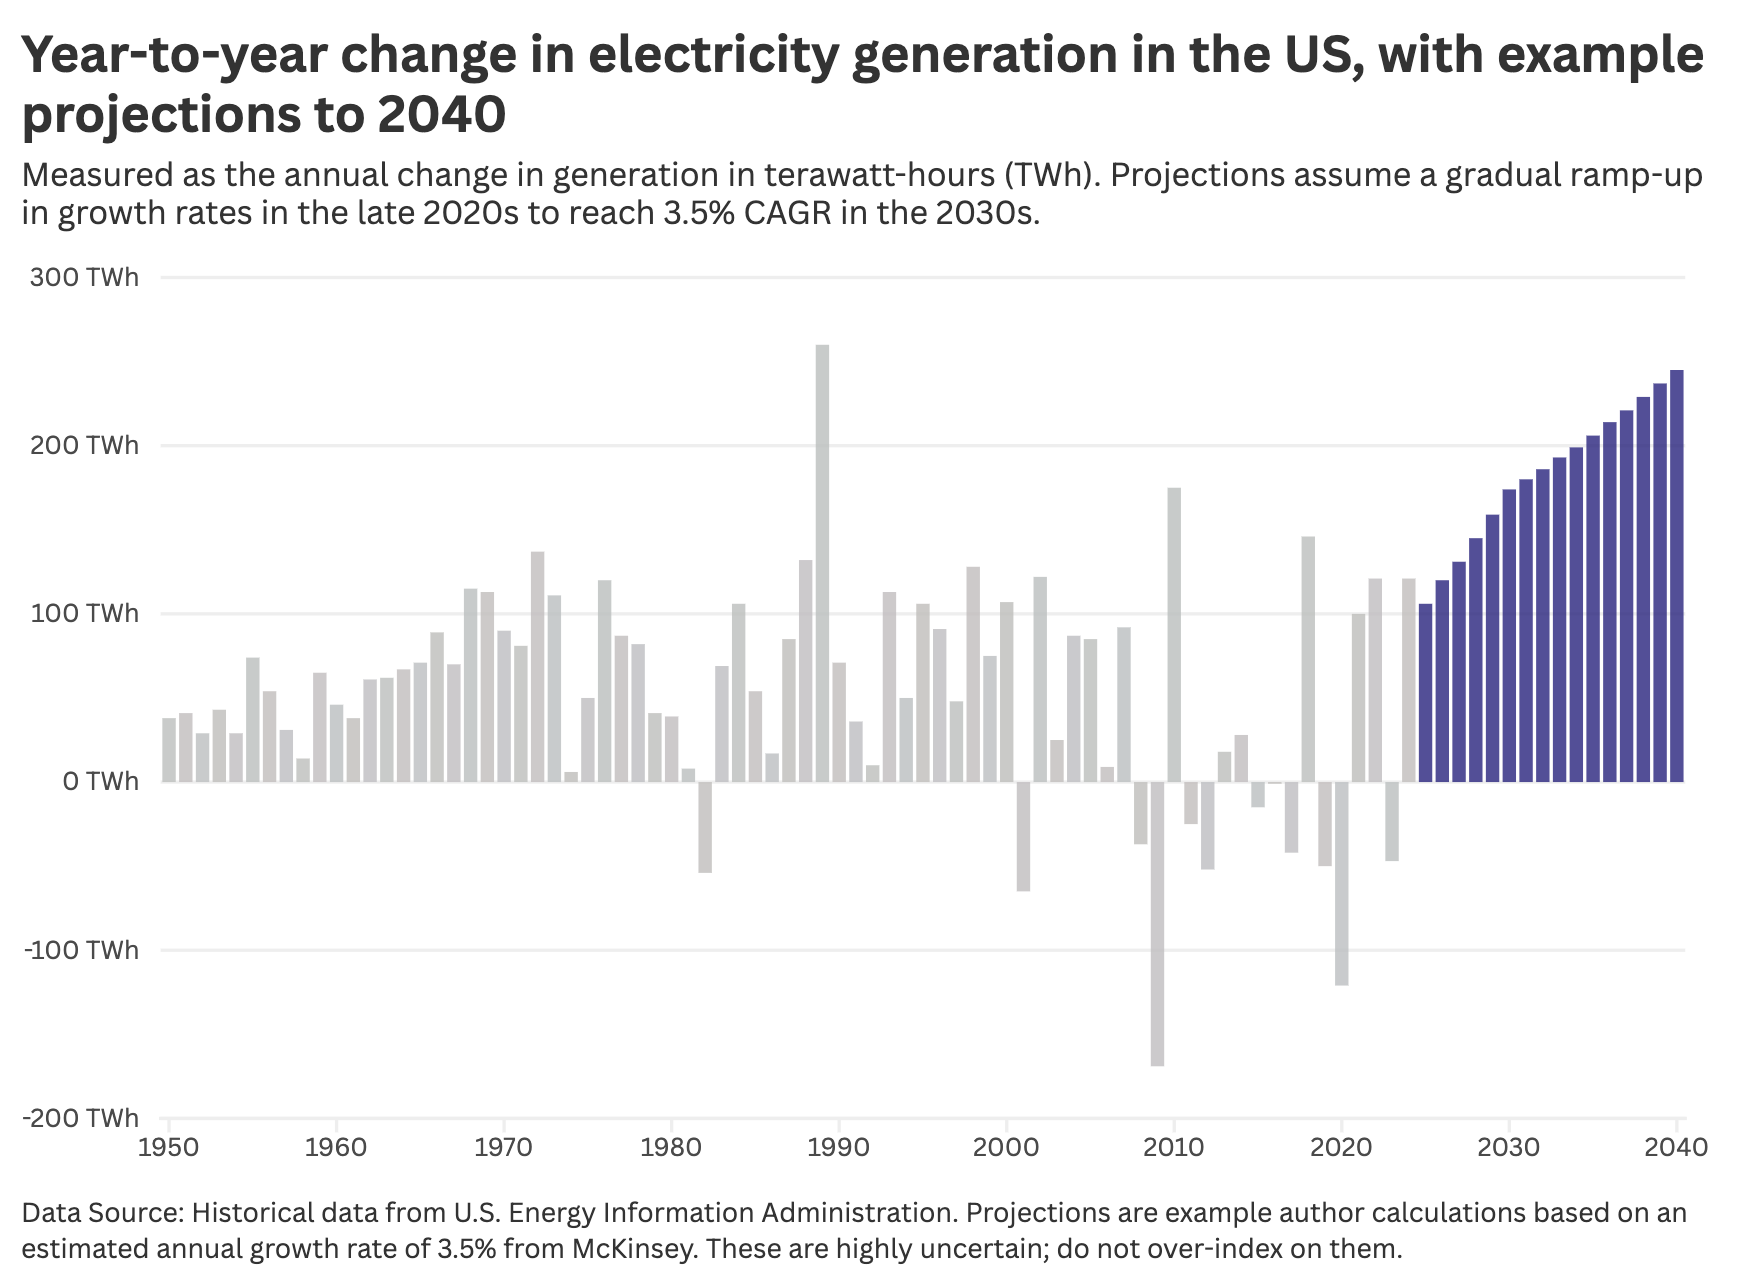
To illustrate what is needed to generate 100 TWh one would need about 13 large (1 GW) nuclear plants, or 17 large (1 GW) Combined Cycle Gas Turbine (CCGT) plants, or 35-40 GW of land-based wind, or 50-60 GW of utility scale solar. (Assuming capacity factors of 92%, 55%, 35% and 25%, respectively.) Not a small task to achieve year after year!
The load growth in the 1960s/70s/80s managed to be met with new power generation. Will it now be more difficult to build the necessary new power generation? The answer is a “Yes and No”. On one side, building new coal fired power plants, which were the dominant technology 50 years ago, is not an option today. On the other hand, renewables, wind and solar, which 50 years ago were not on the map, have grown substantially, initially thanks to federal subsidies, but have become increasingly financially attractive also without subsidies.
The biggest shift in power generation during the last 25 years is the growth of natural gas combined cycle gas turbine (CCGT). It started to take off after 1978 Public Utility Regulatory Policies Act (PURPA) and accelerated with the “shale gas revolution” in the 2000s. It resulted in a remarkable transition from coal to natural gas. About 1,000 TWh of coal was replaced by natural gas. Another 200 TWh of coal was replaced by wind and solar. It was an economically driven change, which also delivered huge environmental benefits with a total reduction of 900 million metric tons of carbon dioxide (CO2). Natural gas is attributed to 600 million metric tons of that reduction. Wind and solar are attributed with the other 300 million metric tons.
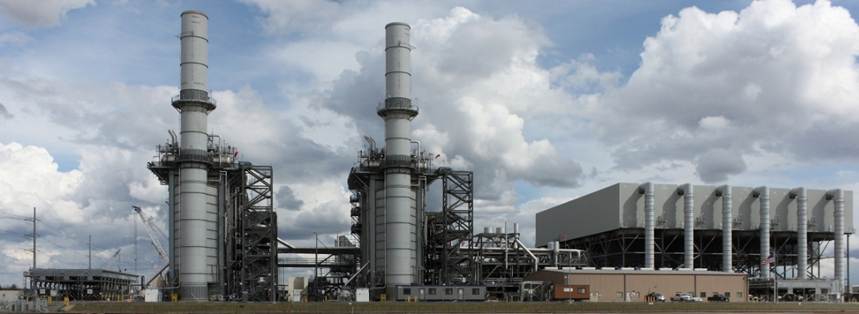
Even if the total generation between 2000 and 2025 increased only by 0.6% on average per year or in total by 16.5%, the shift in the types of power generation was fundamental. Based on EIA data the shift can be summarized in the chart below.
| USA | 2000 | 2025 |
| Total generation | 3,800 TWh | 4,430 TWh |
| Coal | 52% | 16% |
| Nuclear | 20 | 17% |
| Natural gas | 16% | 40% |
| Hydro | 7% | 5-6% |
| Wind | <2% | 10% |
| Solar | <1% | 7-8% |
Nuclear’s share of the mix stayed almost constant mostly thanks to increased efficiency of the existing nuclear fleet, which was built during 1970 -1990. After the Three-Mile Island accident 1979 the “boom” was over. 67 nuclear projects were cancelled in the following nine years. Only three new nuclear plants went into operation during this period: TVA’s Watts Bar 2 in Tennessee (2016) and Southern Company’s Vogtle 3 and 4 (2023 and 2024 respectively) in Alabama. The construction of Watt Bar started in 1973, was paused in 1985 and resumed in 2007. Construction of Vogtle 3 and 4 started in 2009. Both were Westinghouse’s new AP1000 design. The cost was budgeted at $14 billion but ended up exceedingly well over $30 billion. The delays and cost overruns can be explained mainly by the fact that the nuclear knowledge and the supply chains from 1970s and 1980s had been largely lost and had to be rebuilt.
An important change in the electric industry during the last 30 years was the deregulation of the electricity markets. It started with the Energy Policy Act of 1992, followed by FERC order 888 in 1996. Before the deregulation, electric utilities operated as vertically integrated regulated monopolies. Utilities were allowed to add “prudently incurred generation” to their rate base. Deregulation made generation competitive. Return on investments had to be earned in the electricity markets and not through the rate base. This fundamental change of risks resulted in independent power producers building new plants rather than the formerly rate-regulated utilities. Presently one-third of the US population live in states which are fully deregulated, both wholesale as well as retail electricity. It includes states like Texas, New York, Illinois, Pennsylvania, Ohio, and New England.
So, what to expect about demand and supply going forward?
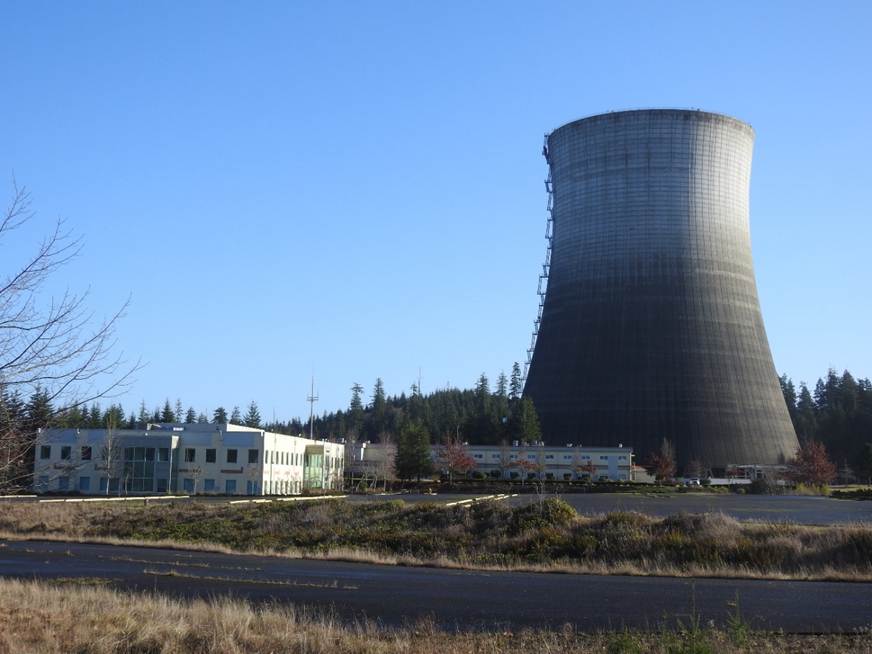
An annual load growth of 3.5% may not happen. The AI driven data center expansion may slow down; the electrification of transportation may also be slower. The “green hydrogen” may not happen. Etc. History tells us it is easy to extrapolate and project too high forecasts. In fact, it happened in the late 70s and early 80s. The most telling example, but not the only one, is nicknamed “WHOOPS.” Washington Public Power Supply System (WPPSS) expecting a high load growth initiated in the mid-1970s with the construction of five new nuclear power plants. Only one got built. The following municipal bond default was then (1983) the largest in US history.
A major change from the past is that the “hyperscalers” of data centers (the biggest being Amazon, Microsoft, Google, Meta, and Apple) are proactive securing necessary power for their data centers. It is driven by urgency and a way to overcome public opposition. A good example is Meta, who just in January this year (2026) announced three separate deals:
- a 20-year power purchase agreement (PPA) with Vistra covering more than 2.6 GW of nuclear power from nuclear plants in Ohio and Pennsylvania,
- an agreement with Oklo to advance an up to 1.2 GW of Aurora Powerhouse “small modular reactors” (SMR) at Aurora campus in Pike County, OH,
- an agreement with TerraPower to accelerate deployment of eight SMR with a combined capacity of 2.8 GW generation combined with 1.2 GW of integrated molten salt storage. Initial units are targeted for delivery in the early 2030s.
Another example is Google with its concept of co-locating data centers with power generation. The first of these energy parks will be in Meitner, TX, with a data center and more than 1 GW of wind, solar and battery storage. Completion expected by 2028. Google also has initiatives including nuclear and geothermal. The objective is to achieve 24/7 firm, always available and carbon-free power.
It is worth noticing that both Google and Meta as well as other hyperscalers includes new nuclear in their plans, with SMR, 70-350 MW, and not with traditional large nuclear plants. Other companies also plan for SMR. One project has cleared the Nuclear Regulatory Commission (NRC) approval, while five more US projects are under review. The first SMR in North America to go online, expected 2028-2029 will be in Ontario, Canada. Worldwide there are 80 SMR projects in various stages of development. China National Nuclear Corporation targets to have its 125 MW ACP100 reactor be operational in 2027. The growth of SMR will be dependent on the outcome of the first projects. For robust growth, it will be crucial to identify the best technologies and standardize them to scale and drive down costs. Realistically, even in a best-case scenario it will be at least another 10-15 years before SMRs start to make any significant contribution to new generation.
In terms of new large nuclear, only two projects are visible: TerraPower with a 500 MW reactor in Kemmerer, WY, and Fermi America LLC with four Westinghouse AP1000 reactors in Carson, TX. TerraPower has received NRC construction permit, and in April this year (2026) nuclear-island construction commenced. For the project in Carson, Fermi America has applied for NRC approval. If the projects go forward, it will probably take another 5-7 years before TerraPower goes live, and 12–15 years for Fermi America.
The next 10-15 years, most of the growth of new generation will be renewables and natural gas. Renewables, wind, solar and potentially also geothermal will likely be the biggest contributors to new generation measured in energy delivered. How much wind and solar can be added to the electric system depends on factors like energy storage and transmission, necessary to mitigate the intermittent nature of wind and solar. Subsidies, or lack thereof, will also have an impact. The expansion of solar and wind accelerated thanks to substantial subsidies. The federal tax credits (production tax credits for wind and investment tax credits for solar) have been estimated to be about $140 billion between 2010 and 2023. The federal tax credits ended on July 4 this year (2026).
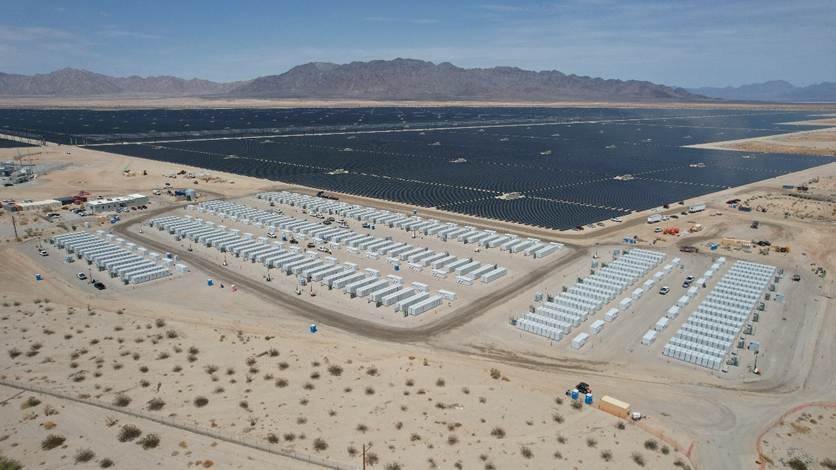
Regarding battery energy storage we can expect more of “hybrid renewable energy systems,” which refers a combination of one or multiple renewable energy sources with battery storage, generally about the same power and four hours of storage. The major benefits of the hybrid system are improved reliability, more continuous power, and surplus generation utilization. The Inflation Reduction Act (IRA), from 2022 through 2025 allowed offset up to 30% of the capital cost for the batteries. Noticeable, according to Lawrence Berkely National Labs (LBNL), behind-the-meter solar systems paired with battery storage keep growing. In 2025 37% of new residential installations have solar combined with batteries.
Geothermal energy has gained interest as a 24×7 dispatchable renewable energy resource. The new concept is Enhanced Geothermal Systems (ESG). It uses horizontal drilling techniques from the oil and gas industry. Since it is not dependent on underground natural reservoirs of hot water, ESG can be located to many more locations and with more energy than traditional geothermal plants. On September 30, this year (2026) Fervo Energy, the leading company in the field of ESG, reached commercial operation with 33 MW Cape Station, UT. The site is expanded to 100 MW expected to come online in January next year (2027). In a second phase the operation is planned to be expanded to 400+ MW in 2028. It is encouraging progress, but still too early to tell whether ESG will be a significant component in the fuel mix by 2040.
In most scenarios natural gas will continue to be significant both as baseload power as well as to balance the intermittency of wind and solar. PJM, the largest regional transmission operator (RTO) in the country, and Texas can serve as indicators on how the fuel mix of generation may develop. PJM has a dedicated capacity market. Participants bid into “base residual auctions” three years out. This capacity auction favors resources, such as natural gas, which can reliably perform during system stress events. Consequently, natural gas has been holding steady at about 45% of the generation clearing at the latest auctions. Natural gas represents 48% of the installed generation capacity in PJM (2025).
ERCOT (Electric Reliability Council of Texas), which covers most of Texas, has no dedicated capacity markets. Instead, it supports its “energy only” model with elaborate markets for reserves and with demand response programs. Thanks to the markets and several types of state subsidies Texas now has over 15,700 MW of battery storage. It has enabled wind and solar to provide over 37.5% of electricity demands during 2025. A prerequisite for this high penetration of wind and solar was the CREZ (Competitive Renewable Energy Zones) transmission project. This 345 kV transmission system can carry up to 10 18,500 MW of power from west Texas, where most of the wind resources are, to the loads in eastern Texas. The project was completed in 2014 at a cost of $6.9 billion, to be recovered through the Texas rate payers. To enable additional very large amounts of renewable energy resources new transmission projects are being outlined in ERCOT’s regional transmission plan. This Strategic Expansion Plan (STEP) includes 2468 miles of new 765 kV transmission. A 765 kV transmission line can move 4-5 times more power than 345 kV transmission line. STEP is estimated to cost around $36 billion with target completion in 2030. Still, natural gas will be needed as dispatchable baseload generation. In fact, Texas has created a loan program, Texas Energy Fund, to support addition of dispatchable power. Loans can be up to 60% of the project costs. As of late 2026 loans have been allocated to support 5,400 MW of dispatchable natural gas generation. Natural gas represents 45% of the installed generation capacity in ERCOT (2025).
While quite different in market design and in the mix of carbon free generation, renewables and nuclear, the numbers from both PJM and ERCOT indicate that natural gas will continue to be a substantial part of the fuel mix for quite some time ahead.
In summary, an annual 3.5% load growth through 2040 is unlikely. Nevertheless, the load growth will be significant, both in relative and absolute numbers. It will be possible but challenging to develop adequate power generating resources to meet the demand. For the next 10 – 15 years, renewables will continue to grow. Natural gas and battery storage systems will also grow and be key in meeting peak power and balancing the system.
New nuclear, small, and big, as well as potentially enhanced geothermal systems will be crucial in providing new carbon free baseload generation. However, there are many challenges to overcome to make these resources competitive. Even in best case scenarios it will take at least 10-15 years to start materializing.